
Everything you need to know about Time Series
Introduction
Most of the data that is collected has a temporal structure. Sometimes there are cases where this structure is hidden or we can ignore it, however, there are some ways that we can use this temporal structure to extract relevant information from the available data.
Knowing how to model time series is an essential skill within data science, as there are structures specific to this type of data that can be explored in all situations.
Everything I put in this guide can be used at any time scale. Keep in mind that: whenever I say days, weeks, hours, or any unit of time, you can understand it as “periods”. Then, let’s get started.
Structure of a Time Series
How do you know you are dealing with a time series? A time series is a series of data points indexed in time order. The most simple time series is something like this:
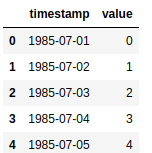
Where the elements are:
- Timestamp: a mark of the moment in time when the event was registered. Its accuracy will depend on the measured event.
- Value: what is the value that this phenomenon had at that moment? Canbe just one or more values. When there is more than one value per timestamp, we have a multivariable time series.
Type of Time Series
Also, it’s important to know that there are two types of time series:
- Regular time series: are those that have a record in each uniform period of time. A daily series of temperatures can be considered a regular series since we expect exactly one record per day, one record per unit of time.
- Irregular time series: are those collected without a defined frequency. An example is the log of accesses to a website. People do not access, uniformly, every N minutes. In this case, we will have records with different time intervals between them.
Time Series Data Preparation
Feature Engineering
To create a machine learning model we need input variables (features — X) and one or more output variables (target — y). There are four essential features, which should be tested on any Time Series problem:
- Lag: The Lag feature is simply using a previous target value as a feature to predict the current one. For example, if you want to predict the price of Apple stock tomorrow, the price today is a really powerful feature, this case is a lag 1 feature. Or if your problem has a weekly seasonality, a lag seven feature will be probably very useful.
- Differences: This feature is very similar to Lag. Only here, instead of using the specific value, we will use the difference from the last period to the previous one. For example, calculating the difference between the number of items sold yesterday and the number of items sold, on the same day of the week, but last week. The most common operation is the difference (subtraction) but we can also use sums, ratios and multiplications.
- Statistical features: In addition to specific values and arithmetic operations on them, we can calculate statistics such as the mean, standard deviation, maximum, minimum, quantiles. In our sales exemple, we can calculate what was the maximum quantity sold of the product, in one day, in the last seven days. The idea is simple, take a window of periods and apply a function on the respective values. Usually, this function should return only one number for each timestamp.
- Timestamp decomposition: We also can extract the relevant parts of our timestamp, usually thing related to its seasonality. Some periods have a differentiated pattern specific to that moment. Some classic examples are Christmas, Black Friday, Mother’s Day, Parents, Valentines. In the days before these dates, there is a significant increase in sales in the trade. In other words, at this time of year, there will always be an increase in sales and the model needs to know that. We can create features such as day of the week, day of the month, month of the year, time of day.
Modelling
Traditionally models for statistical time series are applied in one series at a time. That is, you have only a series of values and apply the desired method to model the process that generates it. At Data Science we can also model one series at a time, just create features that only depend on the values of the series we are trying to predict. However, we can also stack the time series to make a stacked modelling. This way, we can have individual models and stacked models, as the individual models are the traditional approach I will just explain the stack approach in detail.
Stacked modelling
In this case, instead of creating a model for each series, we “stack” them all together and create a global model. What do I mean by stacking?
Imagine that we have a series of the stock price of 10 companies for a year, one record per day. Let’s concatenate all these series into one. Then we will have 10 companies x 365 days = 3650 lines. Each line of the “new series” will have the timestamp, the company identification and the sales value at that moment.
Why do we want to do this?
- More data: Machine learning models tend to work better with a larger amount of data. Instead of making models based on a few records (365 lines in our example), we will be making more lines, allowing the model to capture patterns more robustly.
- Complexity: When it comes to production, monitoring models, keeping them running, it is much simpler to maintain just one model than 10. This reduces the complexity of our solution and avoids implementation errors.
- Global effects: Using several series at once, the model has the opportunity to capture common events between them. Global effects, occurring in several series, will be clearer and captured more easily.
Validation
When we are dealing with time series models, we can not make an incorrect validation, and it is very common to see gravely incorrect validations. If you simply divide your data randomly, as we learned in a lot of courses, you will have a result that will look very good, but it will not actually be reproduced in production. This is because you will be mixing lines from the past and the future, letting your model know about future information to predict the past! This way, in production, there is no way to get a time machine and get this information.
In addition, the entire process is affected by time. Some more quickly, others more slowly, so we need to have an idea of how our model will act with the changes that will happen.
You may be wondering: is the whole process really going to change over time?
Even an image classifier must be affected, as the devices used to take pictures are always changing.
As a rule, models that are directly or indirectly related to human behaviour tend to change faster and require updating (re-training) with a certain frequency. The right frequency depends on the specific case. In general, time series break the assumption of line independence. That is, information from neighbouring lines tends to give hints about the target of the line we selected.
Therefore, the simplest, but already quite robust, way to divide your time data between training and testing, is by separating by date. You can take a specific date or a proportion of your data, usually the first 70% to train and 30% to validation. Or even, can we make a time series cross-validation?
Time Series Cross Validation
Instead of using just one split to validate our model, it’s good to use at least three Cross Validation folds to do so, always splitting the data by the timestamp.
Usually, more recent data tends to be more important for the model. There are two types of “windows” that we can use to validate our model:
- Expandable Window: It means that as time passes, our training data will increase. The figure below can illustrate this process very well.
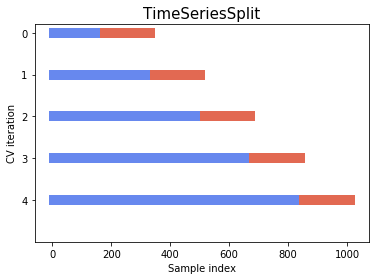
- Sliding Window: In this format, as well as in the calculation of the features, we will slide a fixed window, previously defined, by the data. The sliding window gives you more control over the data you are going to use, making your pipeline more robust when retraining. Even if you have many years of data, it doesn’t mean that you need to use everything to train the model.
A disadvantage of simple cross-validation is that we are validating “some version” of the future, ones that really happened, iterating each version after a small-time variation. But in some cases, the future may behave differently.
This happens a lot in cases of modelling in the financial market. In general, you need to look for time periods with different financial regimes (high, low and stagnation) to validate your models.
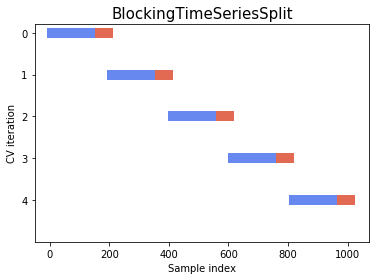
One way that is gaining popularity is by cross-block validation. In general, resampling methods, where you reuse samples of the data in your validation, tend to be more robust.
In the case of time series, as we want to preserve the structure, but simulate different scenarios, we need to take blocks of data without making a random mix, and these block can not have intersections between the cross-validation folds. The most important thing is that the lines that were generated together over time remain together. These can be seen in the figure below:
The Model
Some machine learning models seem to work better with time series data.
Tree Ensembles
Here we are talking about any model that joins several decision trees to make the forecast. The most popular are Random Forest and Gradient Boosted Decision Trees.
Both in competitions and in industry projects we see these models easily finding patterns within time series, being robust to noise and being able to extract values of features little correlated with the target due to their high ability to capture non-linear patterns.
Neural Networks
Multi-layer perceptron (MLP) neural networks are the most traditional that you can use to create models of basically any nature. But there are some types that deal with strings natively.
Convolutional Neural Networks (CNN)
Originally created to handle images, but their use for time series cases has become increasingly popular. Basically, they end up learning filters that multiply the original features within the convolutional windows. This means that we can use the power of learning representations to model time series.
They train faster and have fewer parameters (weights) to adjust than recurrent networks. Still, as in most cases with neural networks, they tend to work better as the amount of data grows. Worth the try for small samples, but don’t expect it to work miracles.
Recurrent Neural Networks (RNN)
The most popular today is Long-Short-Time-Memory (LSTM), are made specifically with sequential data in mind, as is the case with time series. The idea is that not only the current example can influence the result, but the “memory” of past examples can also help in the forecast.
These networks tend to be quite complex, with a large number of parameters to adjust, making them need a large sample to achieve a good result. At the same time, they are very flexible, allowing for a multitude of architectural combinations between the number of entry and exit periods.
Time Decay
Every time series prediction tries to understand human interactions. If the modelled system changes any logic, a trained model will have a performance decay over time. Some models will decay fast, others slowly.
To measure how is your model performing over time, try to monitor its performance and retrain it when the performance drops below a threshold.
The decaying speed will vary on the problem type you are dealing, for example, financial models probably will need retraining in a short period of time, and models prediction the weather can be retrained after a longer period of time.
There are some more robust ways to tell when to retrain time series models, however, this article is already long enough. Some day I can still make an article here about it.
Conclusion
One of the most frequent data available is related to time. Them, for a Data Scientist, is fundamental to understand how to correctly explore, prepare, extract good features,validate and model this kind of data.
With the ideas presented here, you will certainly be able to create high performance and robust models using machine learning with time series.
I hope this overview can help some people, for now I will just leave a book recommendation and a good quote.
Nice to read Time Series books:
- Time Series Forecasting (Francesca Lazzeri): https://amzn.to/2R7qGko
- Python Crash Course (Eric Matthes): https://amzn.to/38gJtPI
- Python for Data Analysis (Wes McKinney): https://amzn.to/2tpgevz
References:
Time Series CV figures are from: https://hub.packtpub.com/cross-validation-strategies-for-time-series-forecasting-tutorial/